

Most municipal departments responsible for signs and pavement assets start in the same place: incomplete spreadsheets, scattered KMLs, and institutional memory.
When a resident calls in a damaged stop sign, when a supervisor needs to schedule a retro-reflectivity inspection cycle, or when a new asset-management system goes live and asks for a clean list of every regulated asset, the data simply isn’t there in the form the work requires.
That’s where Teleqo Tech comes in. Our mobile-mapping fleet and field-execution capabilities, paired with New Compass’s Ranger extraction platform and Pathfinder visualization viewer, turn a single drive-through of the right-of-way into a system of record a DOT can actually use. Two recent projects, the City of Norwalk’s Department of Transportation, Mobility, and Parking (TMP) and the City of Fremont’s Maintenance Operations and IT Services group, show what end-to-end data collection and extraction as a service look like in practice.
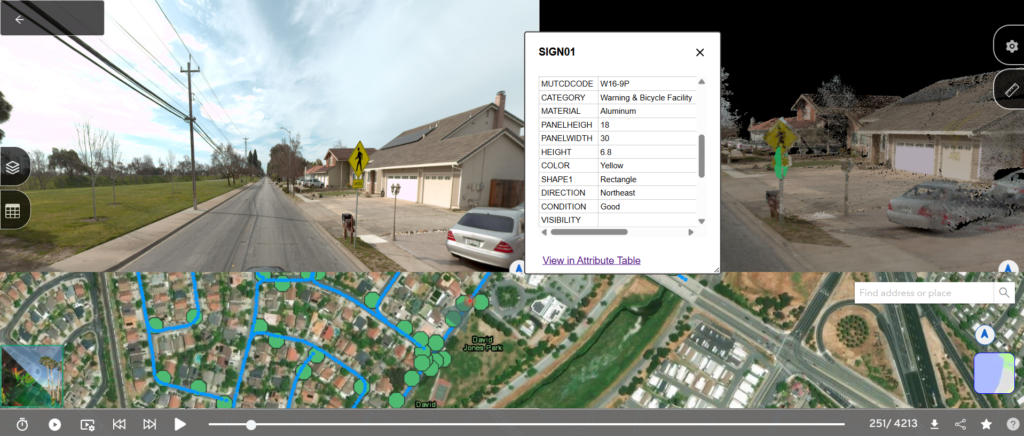
Collection: Putting the Right Platform on the Road
Every Teleqo project begins long before the vehicle leaves the yard. We collaborate with clients to derive drive-lines, identify inaccessible areas, and flag corridors that need multiple passes for full sign capture. The point of this planning is straightforward: every street the city is responsible for gets surveyed once, correctly, with no holes to fill later.
For Norwalk, we deployed an Optech Maverick, a single-unit system pairing a Velodyne HDL-32 LiDAR sensor with a FLIR Ladybug5 spherical camera (six 5-megapixel sensors covering a full 360°) and a NovAtel SPAN-IGM-S1 GPS/IMU. Positional accuracy held to better than three feet per asset. Twenty-two neighborhood hubs covered all 309 centerline miles of the city between August and year-end.
For Fremont, we deployed a Riegl VMY-2 dual-scanner LiDAR system paired with a Ladybug6 360° camera and a vehicle-mounted distance-measuring instrument, with full static and dynamic calibration at the start and end of each collection day. Across nine months of fieldwork, our crews surveyed 612 directional miles broken into 28 neighborhood-scale collection hubs.
Mobile collection is what makes citywide inventories feasible. Our teams average 60 miles of collection per day, which means a survey program that would have taken years of windshield work fits into a single field season. Just as importantly, the colorized point clouds and panoramic imagery we capture become the foundation that every downstream attribute, condition rating, and visual reference is built from.
Extraction: Scaling the Back Office with Ranger
Field collection is only the first half of the job. The harder problem, and the one that historically broke most municipal inventory projects, is turning raw point clouds into an attributed, queryable inventory. A city like Fremont has tens of thousands of signs, and each one needs roughly thirty attributes to be useful: MUTCD code, panel dimensions, color and shape, support material and mounting type, condition rating, retro-reflectivity status, lateral location, visibility, the parent support, and a stable ID that ties back to the city’s existing street-centerline network.
For this phase, our extraction teams work in Ranger, New Compass’s purpose-built extraction platform. Ranger’s MUTCD code database means that when an extractor identifies a sign, selecting the correct code auto-populates the panel’s face characteristics (colors, shape, dimensions, language), keeping attribution uniform across tens of thousands of features. Non-MUTCD assets like Neighborhood Watch placards and city-specific guide signs flow through the same workflow with project-specific dictionaries.
Equally important for a project of this scope is Ranger’s hub-based work management. Both Norwalk and Fremont were structured around neighborhood-scale collection hubs, and every hub could be independently collected, extracted, QC’d, and delivered without waiting on the rest of the city. In Fremont, that turned a single citywide deliverable into 140 discrete trackable tasks (five workflow phases × 28 hubs), which is what kept our schedule honest across nine months and tens of thousands of features.
Throughout extraction, Ranger maintains the parent/child relationship between signs and their supports, a non-trivial bit of data hygiene given that supports often carry multiple panels. On Fremont, we ran an ArcPro relationship-class validation step to confirm the link between every sign and its support before final delivery. Each Fremont asset also received an ID built from the city’s authoritative Street Centerline ID joined to Ranger’s generated asset ID, meaning every row in the geodatabase referenced the city’s own roadway network on arrival.
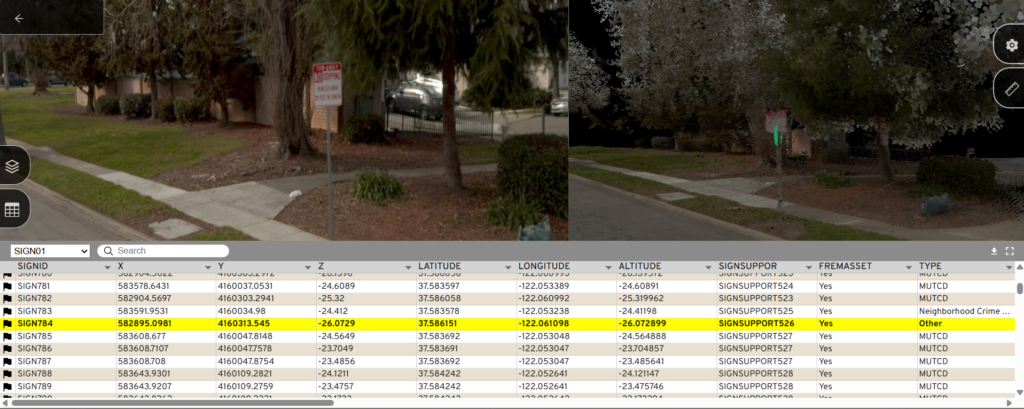
Delivery: Pathfinder Makes the Inventory Usable
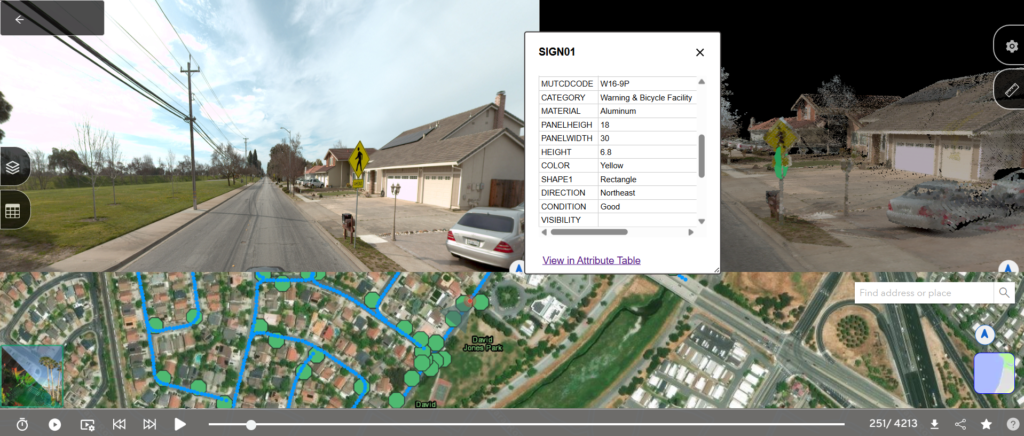
A geodatabase or shapefile is the right primary deliverable for a municipal client; it drops straight into ArcGIS Pro, into Cityworks, into whatever asset-management system the city is standing up. But a database alone isn’t how a maintenance supervisor works day to day; they want to see the asset before dispatching a crew.
That’s where New Compass’s Pathfinder viewer comes in. Every Teleqo project ships with the full inventory published to Pathfinder, so Norwalk’s TMP staff can click on any of the 18,581 signs and pull up the original 360° panorama it was extracted from, with no truck roll required. Fremont’s maintenance team gets the same click-through visual record on every sign and support, with the Pathfinder URL embedded as an attribute on the asset itself.
The combined effect changes the daily workflow. Resident reports about missing or damaged signage become a triage problem rather than a dispatch problem. Replacement planning becomes a database query, not a from-scratch field exercise.
What the Cities Walked Away With
Norwalk’s citywide inventory captured 18,581 signs, 2,766 pavement messages, 120,565 linear feet of pavement markings, and 1,320,807 linear feet of lane markings, alongside a budget-ready replacement-cost estimate of roughly $521,000 for the critical-condition subset, already priced against the city’s own bid sheet.
Fremont received 33,992 sign panels and 23,501 supports keyed to street centerlines, plus a companion geodatabase containing only the critical-condition assets and a parallel retroreflectivity assessment flagging 455 MUTCD signs as non-compliant, providing a ranked, geolocated punch list rather than a network-wide search.
Both cities now have a data foundation that supports the next thing they want to do: MUTCD compliance audits, retro-reflectivity inspection cycles, Cityworks-driven work orders against assets that already exist in the system, and periodic refresh surveys instead of from-scratch field exercises.
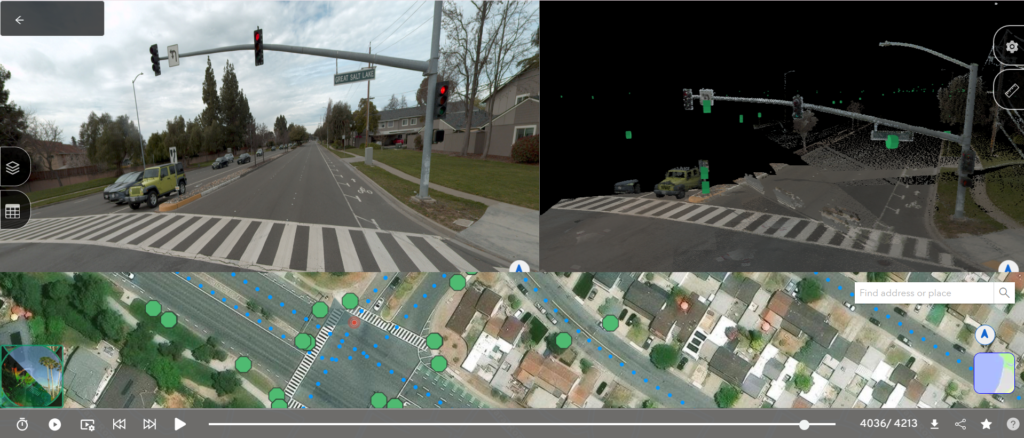
Collection and Extraction, End to End
Cities don’t need a vendor that can do part of this work. They need an inventory that lands ready for their asset-management system, with imagery they can review from a desk, attributed to standards their maintenance staff already work against. That requires field collection capacity, an extraction platform that can scale to citywide volumes without quality drift, and a visualization layer that survives past the deliverable date.
Teleqo Tech owns the field-to-deliverable execution: mobile-mapping platforms, drive-line planning, calibration, and project management from the first collection day through final delivery. New Compass’s Ranger and Pathfinder give us the extraction and data visualization tools that make citywide volumes feasible. The combination is what lets cities like Norwalk and Fremont take a single drive-through of their right-of-way and turn it into an inventory their maintenance teams will rely on for years.
If your municipality is standing up an asset-management system, planning a retro-reflectivity audit, or simply tired of guessing how many signs are in your right-of-way, get in touch with the Teleqo Tech team to start a conversation.